Notebooks show the work.
Start here
What ConflictLens is. A careful count of what the world has recorded about organized violence since 1989 — how much, where, when, and how unevenly it's spread.
What it is not. Not a crystal ball, not a detective, not a judge. It doesn't predict, doesn't name causes, doesn't assign blame.
The promise. Every number you’ll read is produced through code you can open and re-run yourself. Every quantitative claim can be traced back to the underlying work.
The rest of this page walks through the method one idea at a time. No statistics background needed.
What we can and can't tell you
Think of ConflictLens as a very careful accountant, not a detective and not a fortune-teller.
An accountant can tell you exactly what's written in the books: how much was recorded, in which year, and whether one year's entries were larger than another's. That's what this project does well — it counts, compares, and checks whether two things tend to move together.
What an accountant can't do is tell you why the numbers came out that way, or what next year's numbers will be. Neither can we.
- Count what was recorded
- Compare years, places and sources
- Notice when two things rise and fall together
- Predict future violence
- Say what caused it
- Assign blame or responsibility
So we might show you that one year recorded a higher toll than another. We will never tell you why that happened, or what the next year holds.
Where the numbers come from
Every figure rests on witnesses — organisations that document violence around the world.
Our main witness is UCDP (the Uppsala Conflict Data Program), which has recorded organized violence since 1989. A second witness, ACLED, isn't a replacement — we use it to cross-check, the way you'd compare two accounts of the same event. Two more sources, V-Dem and the World Bank's indicators, describe the context of a place: how democratic it is, how wealthy, how large its population.
"Organized violence," in UCDP's sense, is broader than war between armies. It covers three kinds: fighting that involves a state, fighting between armed groups, and violence directed at civilians.
Here is every source behind the current work — what it is, what it's for, and the main catch to keep in mind.
| Source or product | Version, grain and coverage used | Role | Main caveat |
|---|---|---|---|
| UCDP Organized Violence, country-year | v26.1; country-year; 1989–2025 | Primary aggregate conflict source | Records direct deaths under UCDP definitions, not every death caused by war |
| UCDP Georeferenced Events (GED) | v26.1; event; 1989–2025 | Aggregated to unit-year for event counts, fatality estimates, violence-type composition, consistency checks | Aggregation removes location, actor and within-year detail |
| UCDP One-sided Violence | v26.1; actor-location-year; 1989–2025 | Complementary civilian-violence signal | Multi-country records need an explicit allocation rule |
| UCDP Actor Dataset | v26.1; actor metadata | Profiled; not joined to the current panel | Names, coalitions and histories need dedicated harmonisation |
| ACLED summary extracts | Country-year and regional admin-week, downloaded June 2026; from 1997, partial 2026 | Benchmark for political-violence events, fatalities, civilian targeting | Definitions and pipelines differ from UCDP; not a full raw event export |
| V-Dem Country-Year Full+Others | v16; country-year; to 2025 | Macro-context: democracy, rule-of-law, corruption indicators | Only a documented subset retained; non-ISO units usually lack covariates |
| World Development Indicators | Local extract; 1989–2025 | Population and socioeconomic context; denominators for rates | Uneven missingness; no formal release number stored locally |
| UNHCR Refugee Data Finder | Local extract; profiled 1951–2025 | Planned displacement enrichment; not in the current panel | Origin ≠ asylum; stocks must not be read as flows |
| EPR Core | 2021 release; group-year; 1946–2021 | Planned political-ethnic enrichment; not in the current panel | Cannot be joined as one row per country-year |
| SVAC | v3.3; actor/conflict-year; 1989–2023 | Planned sensitive-data layer; not in the current panel | Conflict-related sexual violence needs a dedicated, especially cautious method |
One giant spreadsheet
Before anything else, every dataset is poured into the same shape: one row for each country, for each year, from 1989 to 2025. That grid is the heart of the project.
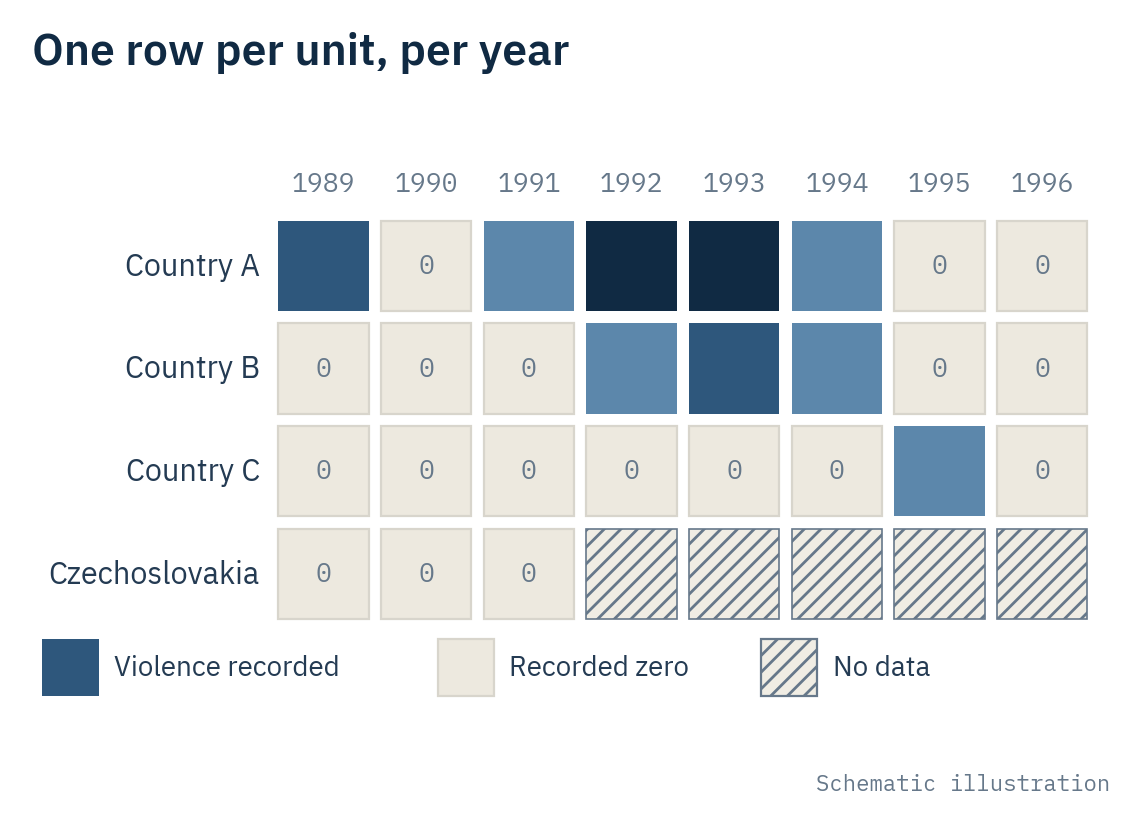
Filling this grid honestly is harder than it sounds. Some entries in the historical record don't fit today's map — Czechoslovakia, East Germany, the two Yemens before they merged. We keep them under their real names rather than quietly filing them under a modern country, because pretending a 1990 record belongs to a country that didn't exist yet would be rewriting history. Kosovo, for instance, is kept as a statistical entry without taking any political side.
The empty-box problem
Here's a subtlety that matters more than it looks: an empty box can mean two completely different things.
Picture a thermometer. If it reads 0°, that's information — it's genuinely cold. But if the thermometer is broken, a blank display tells you nothing at all. Confusing the two would be a serious mistake.
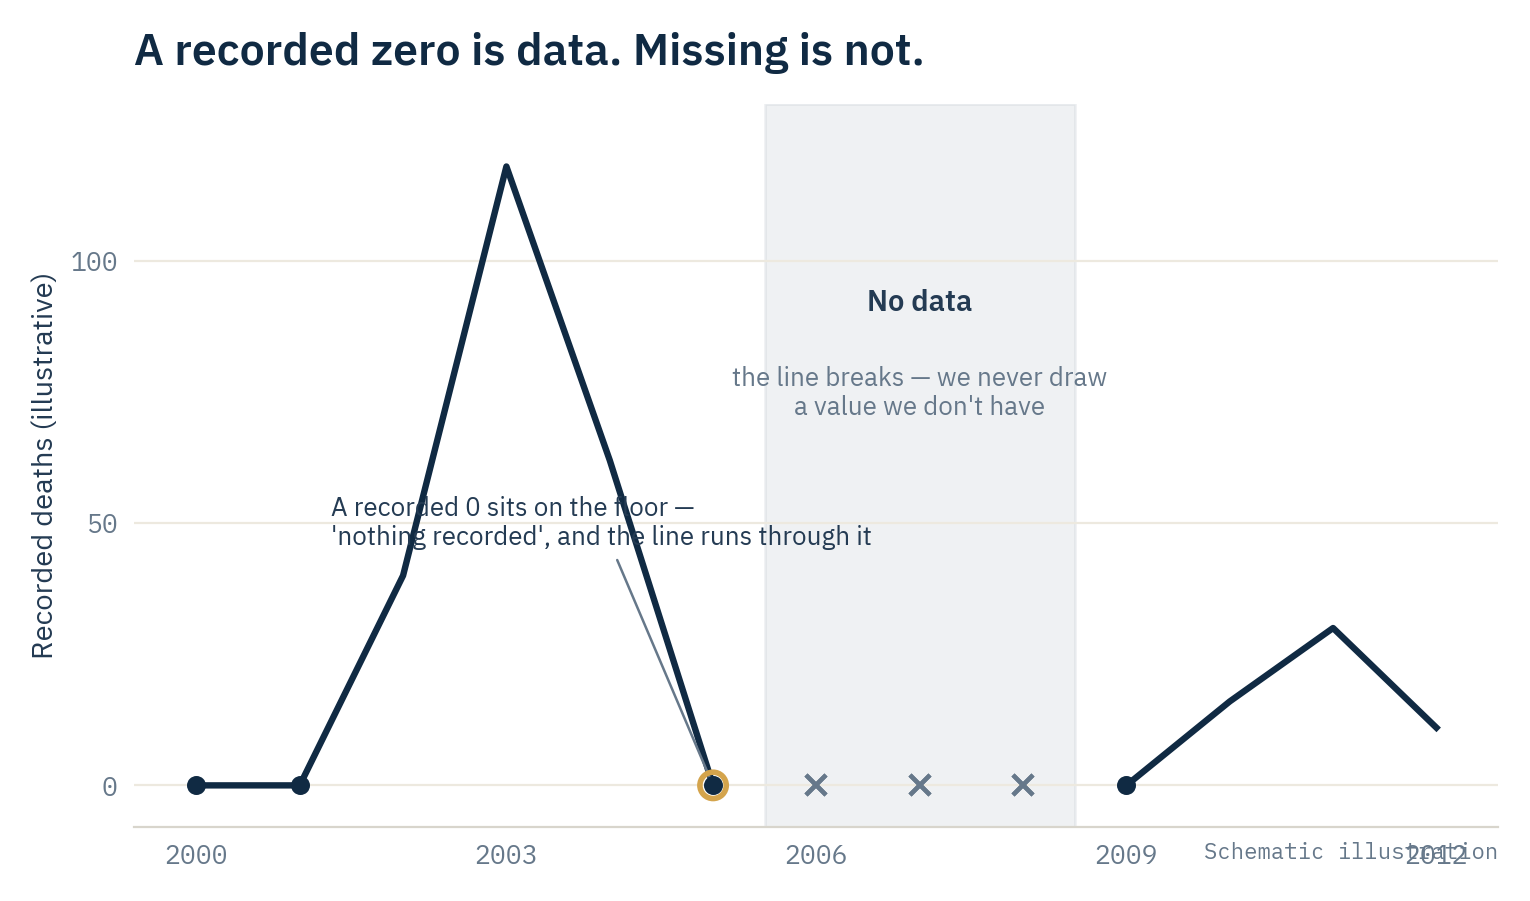
Our grid has the same trap. A 0 means "we checked, and nothing of this kind was recorded here." A blank means "we simply don't have this information" — maybe the source didn't cover that place yet, maybe the country didn't exist. So we only ever write a 0 when we're genuinely sure the box should be empty. Otherwise we leave it blank and say so. We never dress up "we don't know" as "it was zero."
What we actually measure
Once the grid is filled, a few kinds of question follow naturally.
How much, and where? Totals and counts, year by year — and, where it makes sense, adjusted for population, because 100 deaths mean something different in a small country than in a huge one.
How concentrated is it? This is one of the project's core findings. In most years, a small handful of country-years account for the bulk of everything recorded — a few very tall bars towering over a long, low tail.
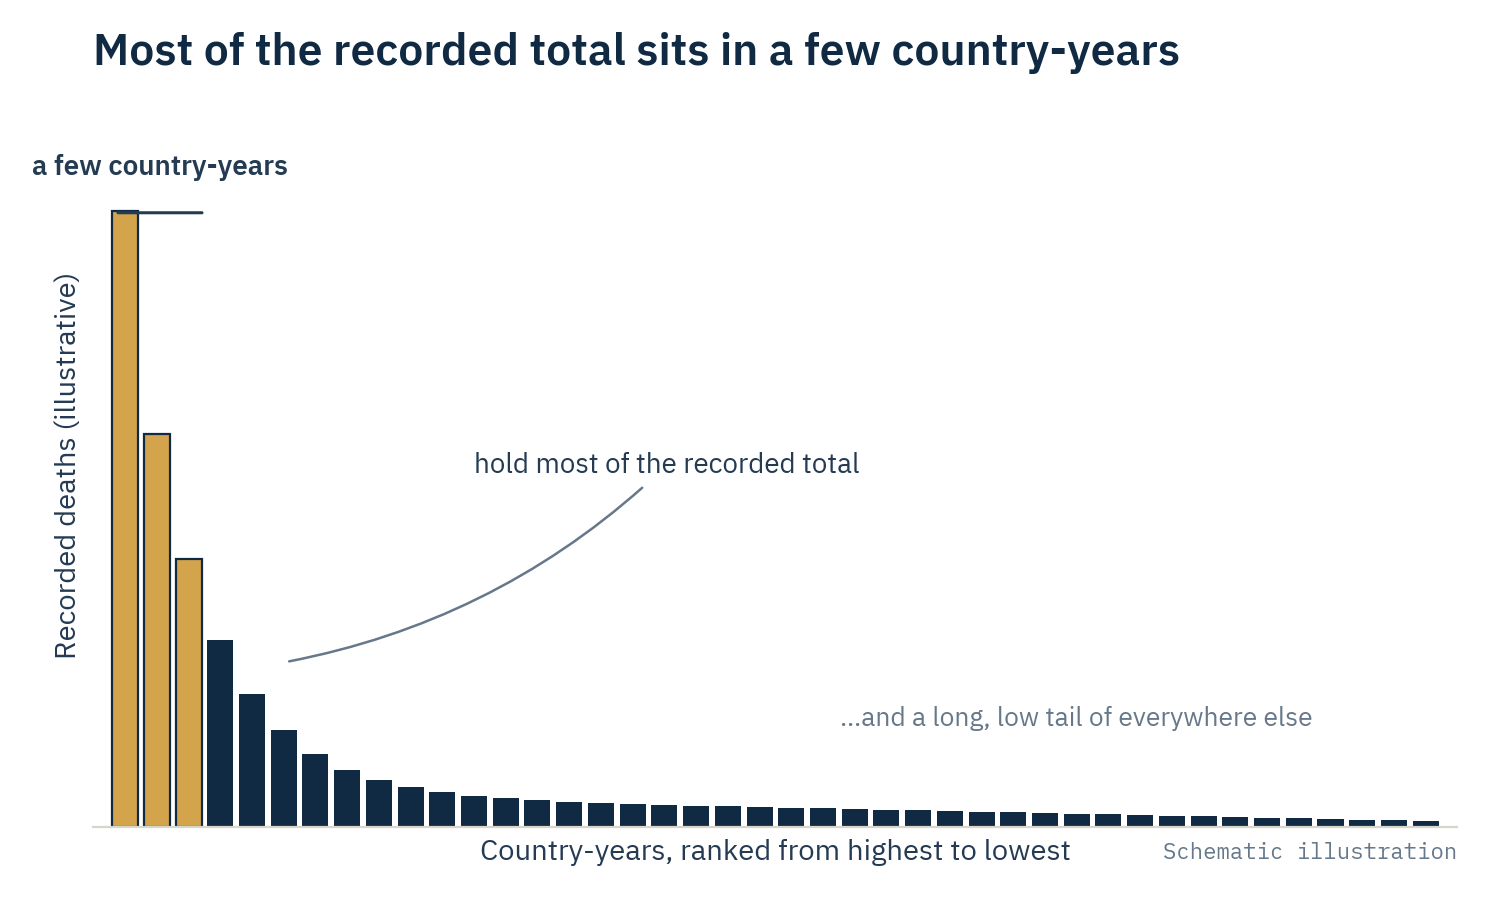
Because so much rides on those few tall bars, we run a simple stress test: what if we removed them? If the whole story falls apart without its two or three biggest cases, that's important to know — so we check, and we tell you.
Is it getting worse or better? We sort each country-year into buckets, from "no conflict" up to "extreme," and watch places move between buckets over time — a bit like tracking whether a patient's condition is improving or worsening from one check-up to the next.
Does it travel with anything else? We line conflict up next to context — how democratic or wealthy a place is — and check whether they tend to rise and fall together. But moving together is not causing. Ice-cream sales and sunburns both climb in summer; nobody thinks ice cream causes sunburn. We hold to that discipline everywhere.
Built to shout when something breaks
You don't want a smoke detector that stays silent when there's a fire. The notebooks are built the same way.
Before producing anything, they run a series of automatic checks: is a row accidentally duplicated? Did merging two datasets quietly change the totals? Is a 0 being written where it shouldn't be? If any check fails, the whole thing stops and raises an alarm rather than handing you a chart that looks polished but is quietly wrong. Every published figure also travels with its own raw data and a small note recording exactly how it was made.
Reading the numbers honestly
A few things stay true no matter how a chart looks, and they matter enough to state plainly.
Recorded deaths are not the full human cost. Deaths from hunger, displacement, disease and collapsed services after the fighting are real, but they fall outside the figures used here. And what is recorded still carries under-reporting and uneven attention across the world. The true toll is almost always higher than any dataset can show.
A number in a country's row is not an accusation. It marks where a recorded value falls in the accounts. It is not a statement about who acted, or who is responsible.
When two sources disagree, that isn't necessarily a mistake. UCDP and ACLED define and count things differently. Their gaps often reveal those differences rather than an error, and we don't pretend one is always right.
The extreme cases are the point, not noise. The worst years and places aren't outliers to be swept aside — they're central to what's being described, and we examine them rather than remove them.
Everything is open
None of this asks you to take our word for it.
The full project — the data pipeline, the analysis, every article's figures — lives in the open repository. If a number ever looks wrong or surprising, you can open the notebook that produced it and watch it being built, step by step:
- Notebook 01 takes stock of the raw sources.
- Notebook 02 builds the giant spreadsheet.
- Notebook 03 runs the main analysis.
- The article notebooks rebuild the exact numbers behind each published piece.
One caveat: the raw source datasets aren't re-published here — they belong to their original providers and must be downloaded from them directly. That's a licensing rule, not a hidden step.
Where we stop
ConflictLens covers 1989 to 2025, one year at a time. It can't capture violence that no source recorded, and its figures remain careful estimates, not exact counts. Because it works year by year, it also loses the fine detail of when within a year, who exactly was involved, and where precisely — a more detailed, event-level view is planned but not yet built.
These limits don't make the work less useful. They're what let it be honest: they mark the line where the data stops, and where we refuse to claim more than it can support.